Monitoring ML Applications in Production
A running model you can't see is one you can't trust. Add a real /metrics endpoint, scrape it with Prometheus, chart it in Grafana, and alert on latency, errors, and the shape of your predictions. Part 9 of the MLOps series.
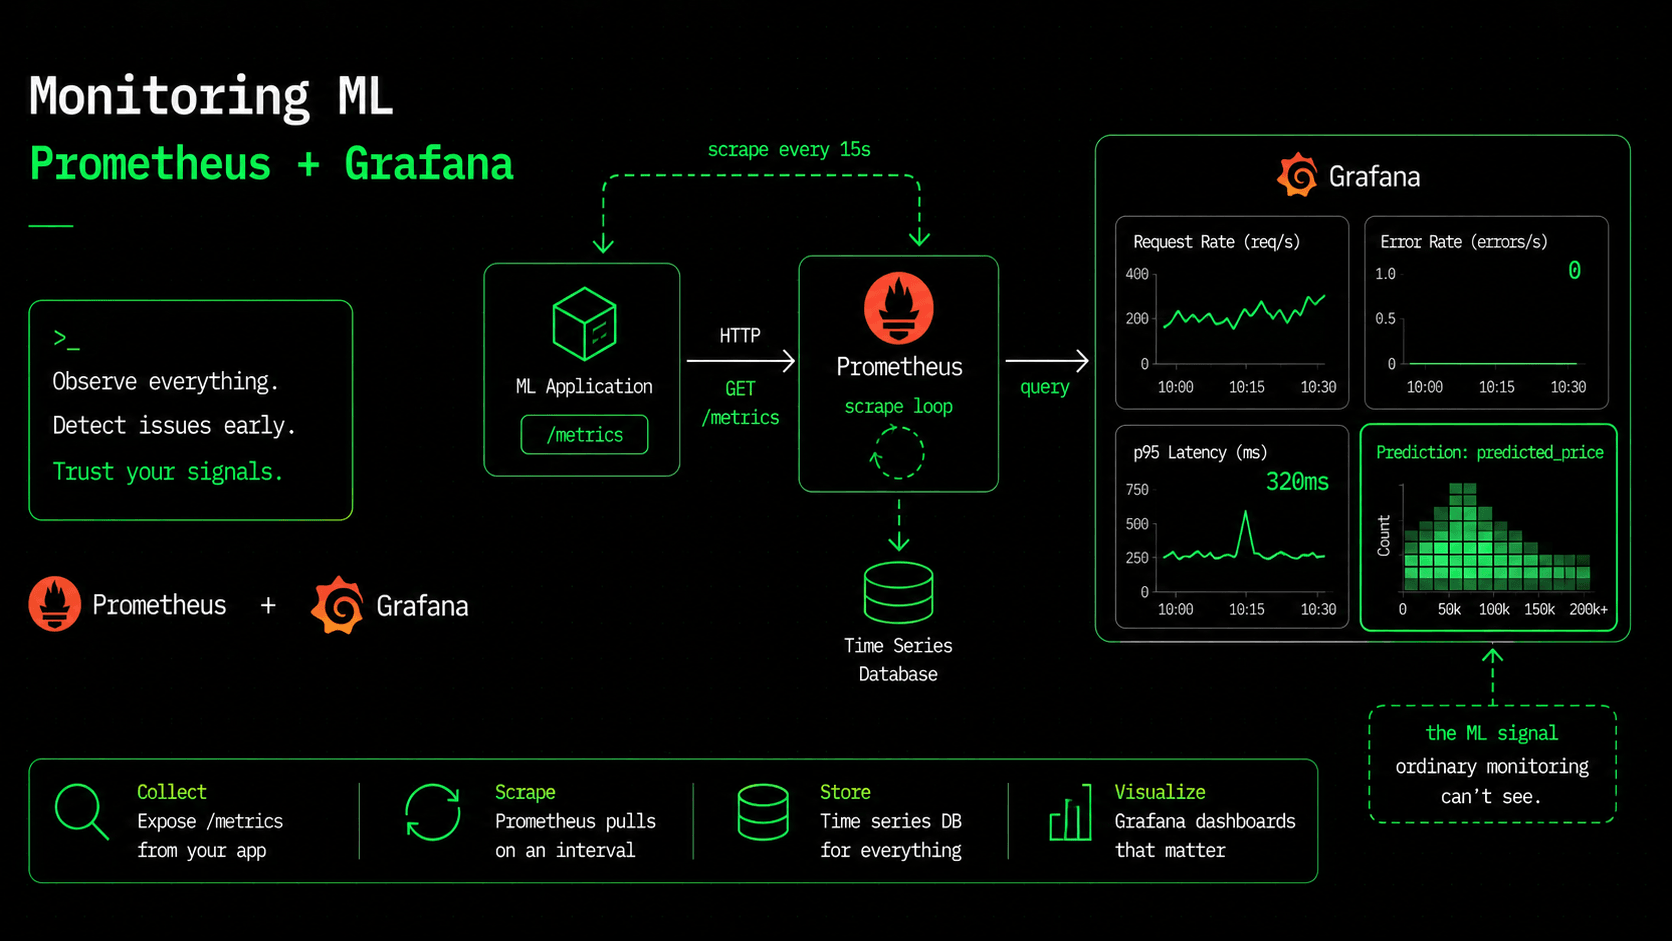
Our platform is fully deployed: a scanned image, a self-healing autoscaling cluster, infrastructure as code. And we're completely blind. Right now, the only thing we know about the running service is that its health check is green, which tells us the process is up, and says nothing about whether it's fast, whether it's throwing errors, or whether its predictions still make sense. A green checkmark isn't observability. It only means one specific alarm isn't ringing.
Monitoring a model server has two layers. The first is the same monitoring you would put on any web service: request rate, error rate, latency. The second is unique to ML, and it's the reason this series has a part ten: watching the predictions themselves. A model can be fast, healthy, and returning 200s — while quietly getting the answers wrong. This part builds the first layer and plants the sensor for the second.
Metrics start in the app, not the dashboard
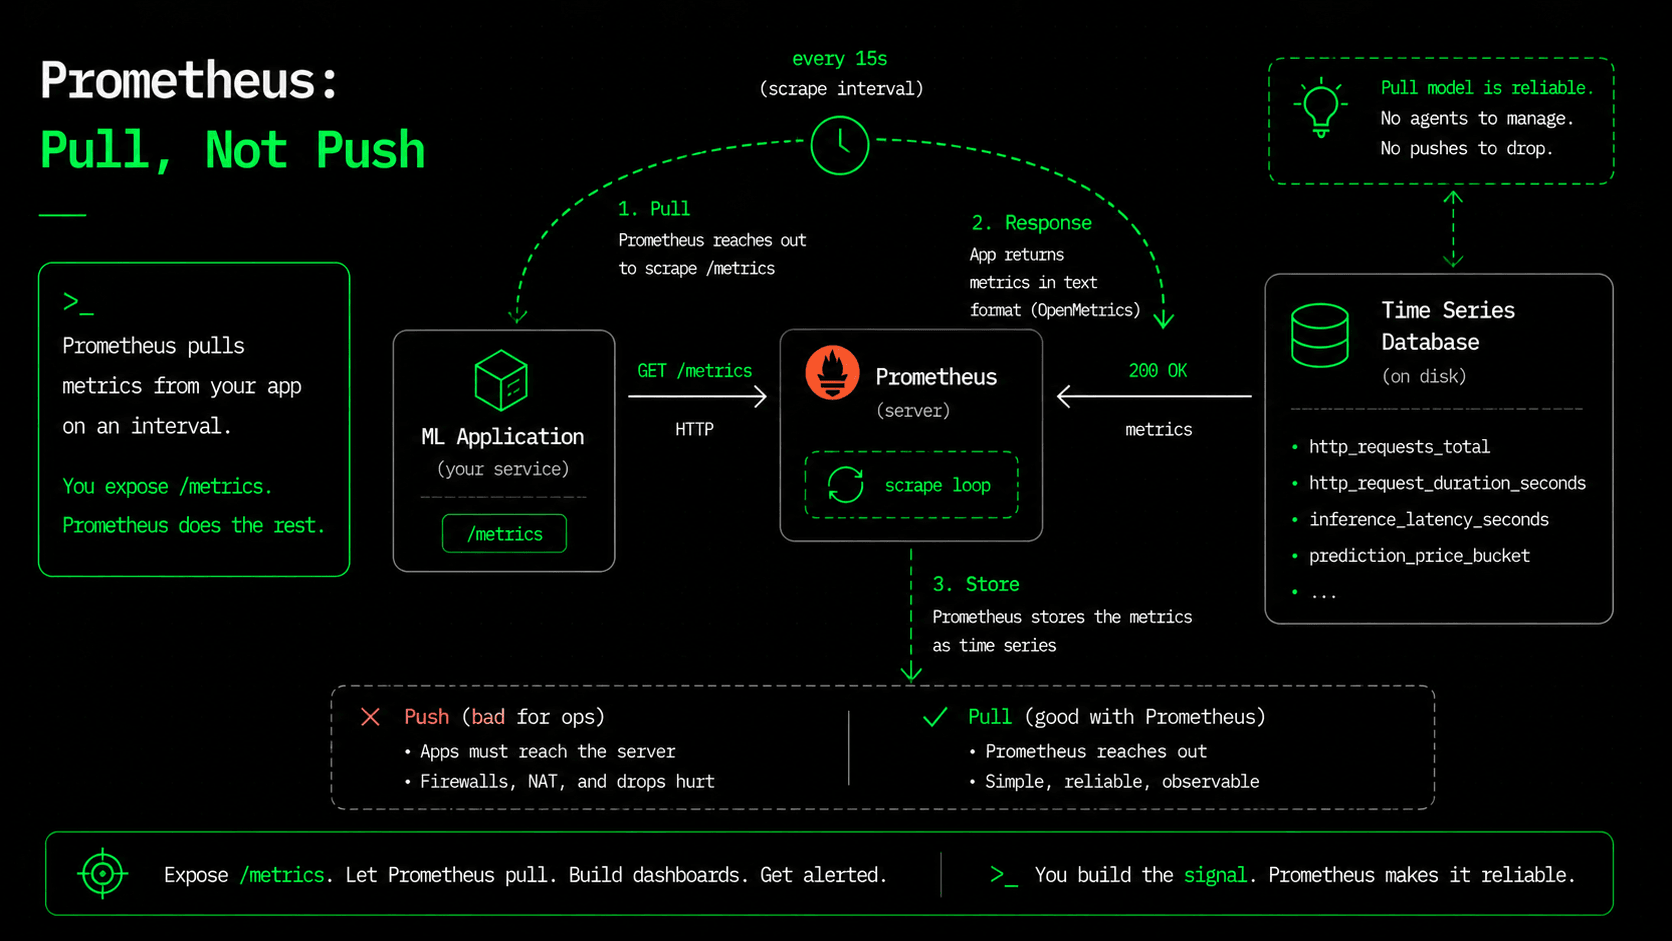
You can't chart what you don't measure. Prometheus works by pulling: your app exposes a /metrics endpoint in a plain text format, and Prometheus reads ("scrapes") it on a schedule. For FastAPI, the instrumentator library gives you the standard HTTP metrics — request counts, latencies, status codes — in about two lines.
# app/main.py
from prometheus_fastapi_instrumentator import Instrumentator

app = FastAPI(title="House Price Inference API", lifespan=lifespan)

# Expose default HTTP metrics (count, latency, status) at GET /metrics.
Instrumentator().instrument(app).expose(app, endpoint="/metrics")
That alone gets you the golden signals for the service. But the generic HTTP metrics can't see anything model-specific, so we add two custom metrics of our own: how many predictions we've served, and the distribution of the values we're predicting.
# app/metrics.py
from prometheus_client import Counter, Histogram

PREDICTIONS = Counter("predictions_total", "Total predictions served", ["endpoint"])

# The SHAPE of what we predict — our cheapest early-warning signal for drift.
PREDICTED_PRICE = Histogram(
    "predicted_price_dollars", "Distribution of predicted house prices (USD)",
    buckets=(100_000, 200_000, 300_000, 400_000, 500_000, 750_000, 1_000_000),
)

# in the /predict handler:
PREDICTIONS.labels(endpoint="single").inc()
PREDICTED_PRICE.observe(price)
Fire a few requests at the running service and curl /metrics, and the numbers are really there — HTTP metrics and our own, side by side:
predictions_total{endpoint="single"} 3.0
predictions_total{endpoint="batch"} 1.0
predicted_price_dollars_count 4.0
http_requests_total{handler="/predict",method="POST",status="2xx"} 3.0
http_request_duration_seconds_bucket{handler="/predict",method="POST",le="0.1"} 3.0
That's real output from the service we've been building. The important line is predicted_price_dollars. Nothing else in the stack — not the load balancer, not Kubernetes, not the HTTP metrics — can see the values your model produces. That histogram is a sensor pointed straight at the model's behavior, and in part ten it becomes the thing that catches drift.
Prometheus: pull, don't push
Prometheus scrapes every target on an interval and stores the results as time series. The config is short: where to look, how often.
global:
  scrape_interval: 15s

rule_files:
  - alert.rules.yml     # load the alerts below

scrape_configs:
  - job_name: house-price-api
    metrics_path: /metrics
    static_configs:
      - targets: ["api:8000"]
On Kubernetes you rarely hard-code targets like this. You run the Prometheus Operator and drop a ServiceMonitor next to your app, and Prometheus discovers every matching pod automatically, so when the HPA from part seven scales you from two pods to eight, all eight get scraped without touching any config. The pull model and service discovery are exactly why Prometheus fits a world where pods come and go.
Grafana: turn series into a story
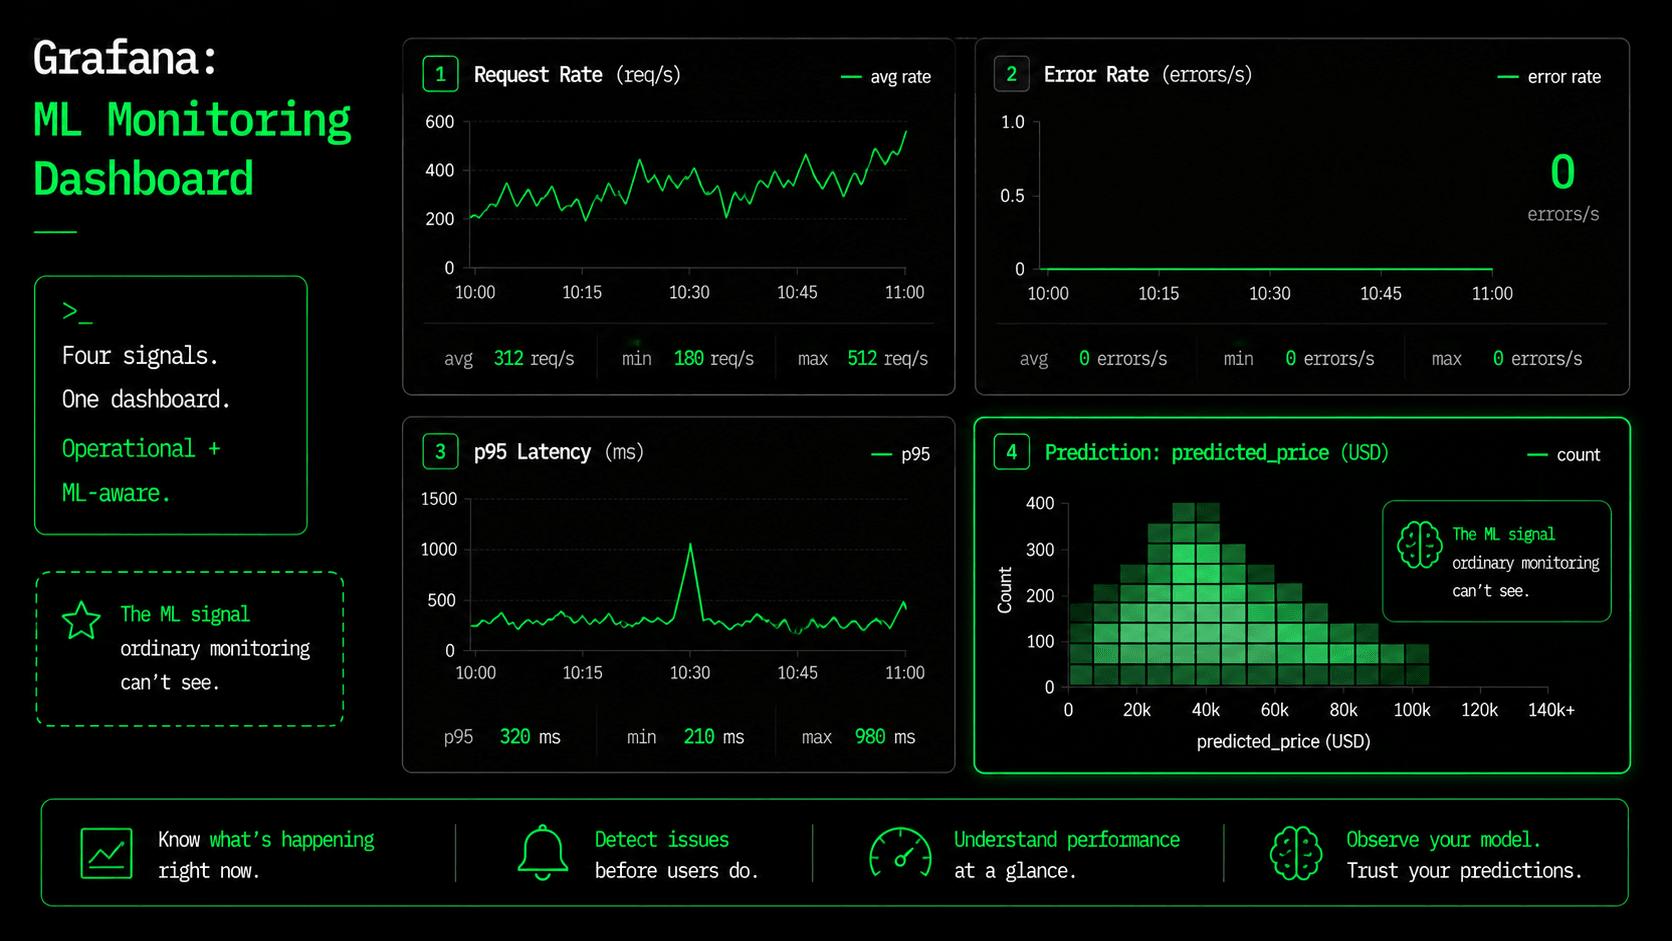
Prometheus stores and queries the data; Grafana makes it readable. You point Grafana at Prometheus as a data source and build a dashboard from PromQL queries. For a model server, four panels tell you almost everything at a glance:
- →Request rate — sum(rate(http_requests_total[5m])), split by endpoint. Traffic, at a glance.
- →Error rate — the ratio of 5xx to total. The number that should be flat at zero.
- →p95 latency — histogram_quantile(0.95, ...) over the duration buckets. Averages hide the slow tail; p95 doesn't. (One caveat: the per-handler histogram ships with just three buckets — 0.1, 0.5, 1s — so this p95 is a coarse estimate; add finer buckets if you need a tight SLO.)
- →Prediction distribution — a heatmap of predicted_price_dollars over time. This is the ML panel, and it's the one that catches a model going wrong while everything else stays green.
That last panel deserves attention. If the mix of predicted prices suddenly shifts (everything moving high, or collapsing into one bucket), something changed in the inputs or the model, often days before it shows up in any business metric. Latency and errors tell you the service is sick. The prediction distribution tells you the model is sick: a failure mode that ordinary monitoring simply can't see.
Alerts: get told before your users tell you
A dashboard only helps when someone's looking at it. Alerts are the part that wakes you up, and they're built from the same metrics. Three earn their place for a model server:
groups:
  - name: house-price-api
    rules:
      - alert: HighErrorRate
        expr: sum(rate(http_requests_total{handler="/predict",status=~"5.."}[5m]))
              / sum(rate(http_requests_total{handler="/predict"}[5m])) > 0.05
        for: 5m
      - alert: HighPredictionLatency
        expr: histogram_quantile(0.95,
                sum(rate(http_request_duration_seconds_bucket{handler="/predict"}[5m])) by (le)
              ) > 0.5
        for: 10m
      - alert: NoPredictions
        expr: sum(rate(predictions_total[10m])) == 0
        for: 15m
HighErrorRate and HighPredictionLatency are your standard service alarms — 5xx above 5%, p95 latency above half a second. NoPredictions is the sneaky one: the service can be healthy and returning 200s to its health check while serving zero real traffic, because a bad deploy left it out of the load balancer. A model that nobody is calling is its own kind of outage, and only a metric on predictions_total catches it. The for: clauses matter too — they stop a five-second blip from waking you up, so alerts stay signals you act on instead of noise you learn to ignore.
What's next
We can now see the service and the model: traffic, errors, latency, and the live shape of our predictions, with alerts on all four. But notice what monitoring does and doesn't do. It tells you something changed; it doesn't retrain anything. That predicted-price histogram will happily show you the distribution drifting, and then keep serving a model that slowly goes stale. In part ten we close that loop: detect data and concept drift for real, and trigger an automated retraining pipeline when the model's world has moved too far from the one it learned. The monitoring configs are in the series repo under monitoring/. See you in part ten.
$ ./work-with-me.sh
Want this in your job, not just your notes?
I take engineers from wherever they are to hired-in-6-months — real projects, code reviews, and mock interviews. Or if you just need a hand shipping something to production, let's work together.
or subscribe on YouTube — free, forever.
$ subscribe --new-articles
Get new articles in your inbox
One email when a new hands-on guide goes live — Kubernetes, AWS, CI/CD, MLOps. No spam, unsubscribe anytime.