Draft — the system is built, the drills are not all run yet. Every number here is marked pending until it is measured.
What a self-hosted LLM really costs on AWS, and how I stopped paying for an idle GPU
One SageMaker GPU for a private vision model costs $4.17 an hour, which is about $3,044 a month if it never stops. In three days of testing the models did ten minutes of actual work. This is the on-demand GPU controller I built, the bug that switched the GPU off in the middle of someone's session, and the measured cost of an 11-minute cold start.
The problem · “Our private LLM costs thousands a month and sits idle most of the day.”
My runbook said the GPU would cost about $2.40 an hour. The first AWS bill said $4.17. At that rate, one GPU left running costs $100 a day, or about $3,044 a month, and this one sits idle whenever nobody is uploading a document.
The GPU serves a KYC platform I built for a Pakistani client: two open-source vision models, Qwen3-VL-8B and PaddleOCR-VL, running in vLLM on one ml.g6e.xlarge (an NVIDIA L40S with 48 GB) in Singapore. The models run inside the client's own AWS account because the documents are national ID cards. The first case study covers how that deployment is secured. This one covers what it costs, and how the GPU went from a fixed monthly cost to one billed only for the hours it is used.
The bill, line by line
- GPU price (ml.g6e.xlarge, SageMaker real-time)
- $4.17/hour
- The same GPU, never switched off
- $3,044/month
- Hours the GPU was up during testing
- ~15 hours
- Actual inference work in the same period
- 10 min 18 s
- Everything else, for a full day
- $18.03/day
2.73 billed hours cost $11.38 on 20–21 September. My planning document said $2.40.
Arithmetic: $4.17 × 730 hours.
20–22 September. The 22nd is from the controller's start and stop log lines, because it was not on the bill yet.
The sum of every model call's duration, 232 calls. The GPU was busy about 1.1% of the time it was up.
21 September: VPC interface endpoints $7.49, Fargate $4.30, Postgres $2.45, NAT $1.42, the rest under $1 each.
That fourth row is the whole case for this piece. During a pilot, an applicant uploads a handful of documents, and each model call takes about two seconds. The GPU spends almost all of its paid time waiting.
Why I did not just let AWS autoscale it
The obvious answer is autoscaling. Three things ruled it out here:
- →This endpoint cannot go below one instance. It is a classic real-time endpoint, one model on a production variant, and that kind of endpoint keeps at least one instance running. SageMaker's asynchronous endpoints and inference components can scale to zero, and either is worth a look for a new build.
- →The quota is exactly one GPU. This account has an EC2 GPU quota of zero in every region, and a SageMaker quota of one
ml.g6e.xlargein Singapore.UpdateEndpointdoes a blue/green swap that needs a second instance, so it always fails. Every change has to be delete, wait until it is gone, then create. - →The platform needed more than scaling. It needed a way to switch verification off entirely, to run the GPU during Karachi business hours, to never stop in the middle of someone's document, and to tell applicants honestly when the GPU is starting.
So the application owns the endpoint's lifecycle, and the GPU mode is a setting in the admin panel.
Four modes, one decision function
- →Always on. Kept running. Results in seconds, and the $3,044-a-month bill.
- →Scheduled. Always on during set hours (by default 09:00 to 21:00 Karachi time, Monday to Friday), and on demand outside them.
- →On demand. Starts when an applicant enters an access code or uploads a document, and stops after 30 idle minutes. The first applicant after a quiet period waits for a cold start.
- →Off. Never started. New applicants see "Verification is paused".
Whether the GPU should be running is a pure function of the mode, the queue and the time since the last applicant activity. It calls no AWS API and touches no database, so every rule in it is covered by a unit test:
def wants_gpu(cfg, last_activity_at, backlog, now) -> bool:
    """Whether the GPU should be running right now under the chosen mode."""
    if cfg.mode == GpuMode.ALWAYS_ON:
        return True
    if cfg.mode == GpuMode.OFF:
        return False
    if cfg.mode == GpuMode.SCHEDULED and cfg.in_schedule(now):
        return True
    # On demand, and scheduled mode outside its hours.
    if backlog > 0:
        return True
    if last_activity_at is None:
        return False
    return now - last_activity_at < timedelta(minutes=cfg.idle_minutes)
A second pure function turns "should it run?" into at most one action per tick, with the rules that make it safe:
- →Never stop with work in flight. If a message is being processed, the stop waits for the next tick. A document is never cut off in the middle of inference.
- →Unknown queue depth counts as work. If SQS cannot be read, the controller assumes there is a backlog. Failing towards "on" costs money. Failing towards "off" loses an applicant.
- →A failed start is cleared, then backed off. A
Failedendpoint is deleted to free the one-instance quota, and the controller waits ten minutes before trying again, because each attempt holds the GPU for up to the full startup timeout. - →Creating and updating states are waited out. SageMaker rejects
DeleteEndpointwhile an endpoint is changing state, so the controller never tries.
Terraform builds it; the application turns it on
Terraform creates the model and the endpoint configuration. It does not own the endpoint itself. If it did, every terraform apply would recreate an endpoint the controller had deliberately stopped, at $4.17 an hour. A removed block took it out of the state without deleting the running endpoint:
# The ENDPOINT is deliberately not managed here. The worker's GPU
# controller creates and deletes it under the GPU mode, starting it from
# the newest endpoint configuration below.
#
# destroy = false drops it from state without deleting it, so adopting
# this change does not interrupt a running endpoint.
removed {
  from = aws_sagemaker_endpoint.this

  lifecycle {
    destroy = false
  }
}
The endpoint configuration's name is a hash of the settings that matter: the image, the instance type and the model. An earlier version used timestamp(), which changes on every plan, so every apply replaced the configuration and the endpoint behind it. That meant a full model reload, even for a no-op apply. With a content hash, the name changes only when the deployment actually does.
The worker's IAM role can create and delete exactly one endpoint name, using only configurations named after it. It cannot touch any other SageMaker resource in the account.
Many workers, one controller
Every worker task runs the controller loop every 15 seconds. Only one of them acts on each tick. The others only observe the endpoint, so that each one knows whether to take documents off the queue. A Postgres advisory lock picks the leader, which avoids adding a lock service just for this:
def _leader_lock() -> bool:
    """One controller acts per tick. Released when the transaction ends."""
    with connection.cursor() as cursor:
        cursor.execute("SELECT pg_try_advisory_xact_lock(%s)", [_LOCK_KEY])
        return bool(cursor.fetchone()[0])
What the applicant sees during an 11-minute cold start
Switching the GPU off is only acceptable if nothing is lost while it is off. Three rules make sure of that:
- →Documents wait in the queue; they do not fail. While the endpoint is not
InService, workers leave messages on SQS instead of failing them against a GPU that is still loading. The page tells the applicant their documents are being held until verification starts. - →Checks that need no GPU run straight away. A blurry photo, glare on the card, or a photocopy submitted instead of the original card are all detected on the CPU in the worker. The applicant hears about them immediately, not eleven minutes later.
- →Waiting documents are not deleted. The platform deletes document images within an hour of processing, for privacy. A document still waiting for the GPU is skipped by that sweep for up to 23 hours, and the bucket's one-day expiry stays the absolute limit.
Where the eleven minutes go
I measured two cold starts from the controller's CreateEndpoint call to SageMaker marking the endpoint InService: 11 min 16 s on 21 September and 11 min 24 s on 22 September. Both times were observed on a 15-second tick. The endpoint's own logs break the second one down:
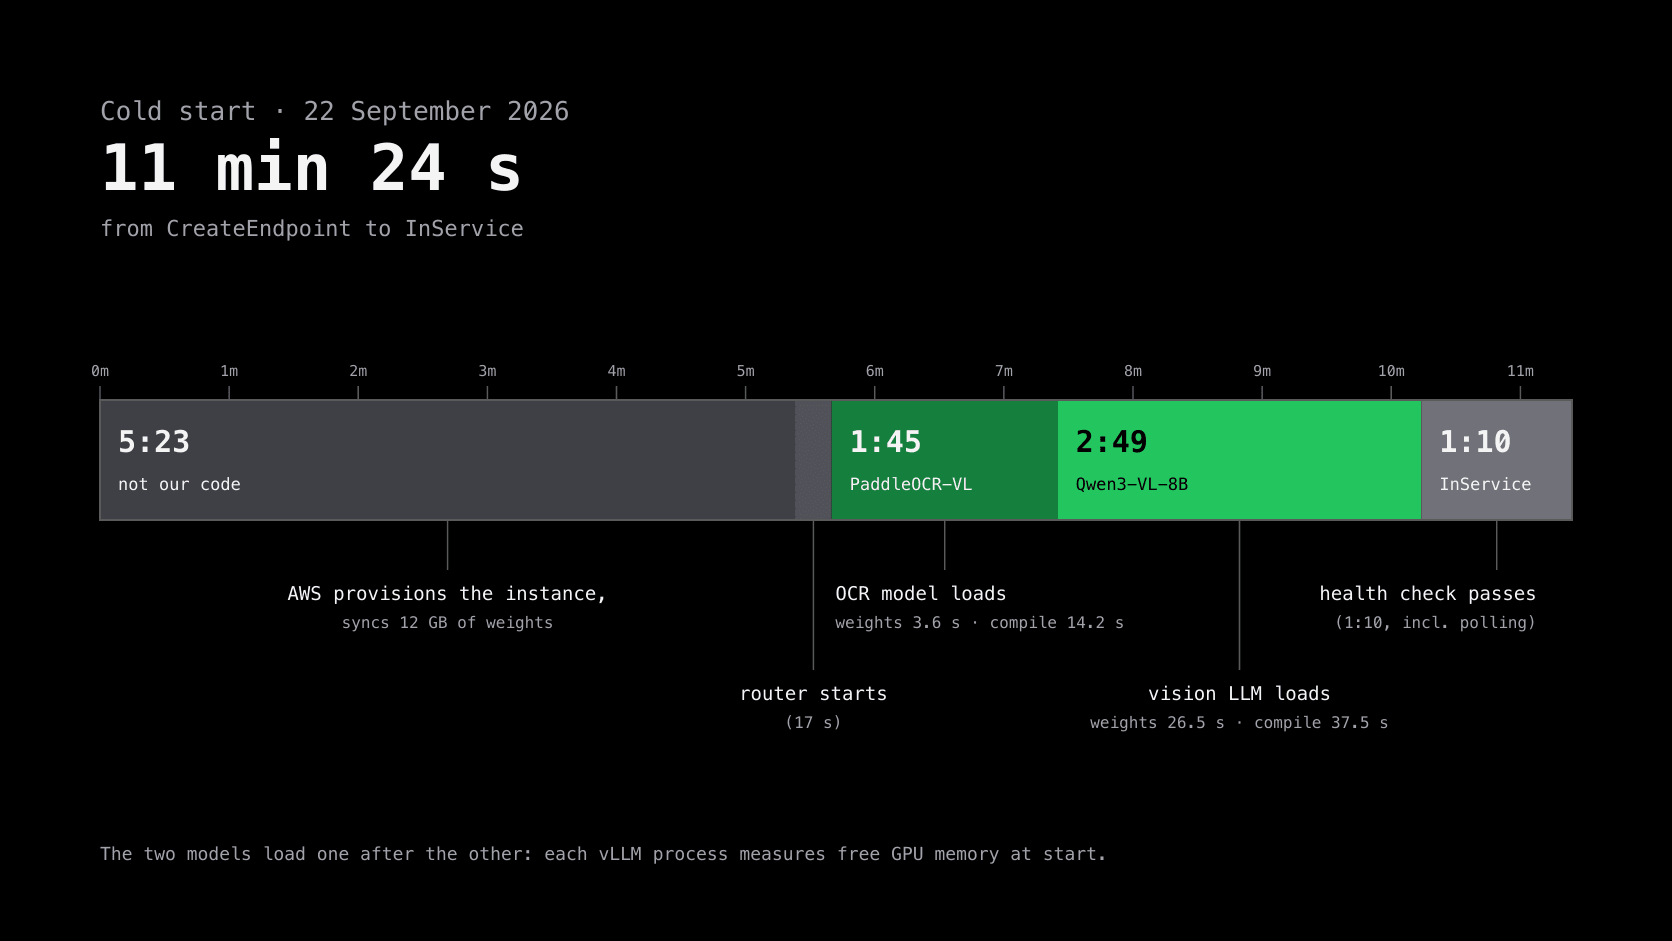
- AWS provisions the instance and syncs the weights
- 5 min 23 s
- Our router starts and checks vLLM's flags
- 17 s
- OCR model (PaddleOCR-VL, 1.8 GB)
- 1 min 45 s
- Vision LLM (Qwen3-VL-8B FP8, 10.3 GB)
- 2 min 49 s
- Health check passes, endpoint InService
- 1 min 10 s
From CreateEndpoint to the container's first log line. None of this is our code.
It reads vllm serve --help before passing optional flags.
Weights 3.6 s, torch.compile 14.2 s, engine warm-up 29.8 s, plus process start.
Weights 26.5 s, torch.compile 37.5 s, engine warm-up 60.8 s.
Includes up to 15 s of the controller's own polling interval.
The two models load one after the other, not in parallel, even though that costs time. Each vLLM process measures free GPU memory when it starts, and two processes measuring at once can both claim the same memory. The health check returns 200 only when both are ready, so SageMaker never routes a request to an endpoint that is only half loaded.
The bug that switched the GPU off mid-session
The first version of the controller had a bug that only a deploy could trigger. A freshly started worker has no record of recent activity, so under on-demand mode its very first tick read a running GPU as idle, and stopped it.
The logs show exactly that. At 15:58:12 UTC on 21 September a new worker came up, saw the endpoint InService, and on the same tick logged gpu controller: stop (the GPU mode wants it off). Fifty-one seconds later the controller started it again, and the GPU was back in service at 16:10:19. That was eleven minutes of cold start that nobody should have had to wait through.
The fix treats a worker's own start time as activity, but only for a GPU that is already running or starting. A running GPU gets one full idle window after a deploy. A stopped GPU is not started by one:
activity = state.last_activity_at
if self.status in ("InService", "Creating") and (
    activity is None or activity < self._booted_at
):
    # A deploy restarts the worker. That is no reason to switch off
    # a GPU someone may be halfway through using: a running GPU gets
    # one full idle window from the restart. A stopped one is not
    # started by it.
    activity = self._booted_at
want = wants_gpu(cfg, activity, waiting + in_flight, now)
The next day the worker restarted six times between 04:17 and 12:02 UTC, and the endpoint stayed in service through every restart.
A second bug was caught before it happened in production. The hourly privacy sweep deletes any document image older than an hour. With the GPU off for longer than that, it would have deleted documents that were still waiting to be read, and the applicant would have had to upload them again. Documents waiting for the GPU are now exempt, up to the bucket's hard one-day limit.
The drills
Deploy during use (before the fix)
Failed- Action
- A new worker started while the GPU was InService.
- Expected
- The GPU keeps running.
- What happened
- The new worker stopped it on its first tick, 20 seconds after it came up. It took 11 min 16 s to bring the GPU back.
Deploy during use (after the fix)
Held- Action
- Six worker restarts on 22 September while the GPU was InService.
- Expected
- The GPU keeps running through every restart.
- What happened
- InService from 04:11:57 until the controller stopped it at 16:19:37, with no stop in between.
Cold start from nothing
Held- Action
- The controller created the endpoint from zero, twice.
- Expected
- InService within the 15-minute startup timeout.
- What happened
- 11 min 16 s and 11 min 24 s.
Upload while the GPU is off
Not yet run- Action
- Upload a blurry photo and a sharp one with the GPU stopped.
- Expected
- The blurry photo is refused at once; the sharp one waits in the queue, the GPU starts, and it is read without a re-upload.
A start that fails
Not yet run- Action
- Point the endpoint at a broken image tag.
- Expected
- The Failed endpoint is deleted to free the quota, the admin panel shows the error, and the next attempt waits ten minutes.
Stop requested mid-document
Not yet run- Action
- Switch the mode to Off while a document is being read.
- Expected
- The stop waits until nothing is in flight. This is unit-tested, but not yet drilled live.
What each mode costs
- Always on
- $3,044/month
- Scheduled, weekdays 09:00–21:00
- ~$1,085/month
- On demand
- $4.17/hr used
- Off
- $0
730 hours.
About 260 hours. On demand still covers evenings and weekends, at extra cost when used.
Every start also pays for 11 minutes of loading and up to 30 idle minutes before it stops.
The GPU line disappears. The private network does not: $7.49 a day in interface endpoints.
One consequence surprised me. Once the GPU is on demand, it is no longer the biggest fixed cost. The VPC interface endpoints that keep the model off the internet cost $228 a month whether or not a single document is processed. In development, that is now the line to cut.
What I would do differently
- →Take the price from the bill on day one. Every estimate I made before the first invoice was 74% low.
- →Benchmark a smaller GPU. The two models together use about 12 GB of weights. An L4 with 24 GB might hold both, with less room for the KV cache. It is the next experiment, not a conclusion.
- →Look at scale-to-zero options first on a new build. Asynchronous endpoints and inference components can now scale to zero. With a one-instance quota and a need for business-hours scheduling, a custom controller was right here. It may not be for you.
- →Treat a deploy as an event the controller must survive. The mid-session stop was obvious in hindsight: any loop that makes decisions from in-memory state has to answer "what happens on the first tick after a restart?"
If your self-hosted model's bill is too high
- →Measure utilisation before you optimise anything. Add up the duration of every inference call, and divide it by the hours the GPU was up.
- →Decide what each hour of downtime costs you in waiting users, and pick a mode per environment: always on in production at peak, on demand in staging, off in development.
- →Keep documents in a queue, never in a failed state, while the model is loading, and run every CPU-only check first.
- →Let Terraform own the model and its configuration, and let the application own whether the endpoint exists.
- →Test what your controller does on its first tick after a deploy.
The application itself, covering how the two models read Pakistani ID cards and why the model never makes the approval decision, is written up on CodeWithMuh.
$ ./audit.sh --your-system
Want this done to your system?
Five days, fixed price, and a written report that tells you exactly what will break in production and in what order to fix it. If your system is the one in this article — inherited, AI-assisted, or working right up until it has customers — that is exactly what the audit is for.
Muhammad Rashid · Senior Backend & DevOps Engineer · LinkedIn · GitHub